- Home
-
- Economic Update 6/22
Economic Update 6/22
Summary1
The Bank's Business Conditions Index indicates that annual growth in business activity has returned to its long-term average.
The European Commission survey shows that in May, economic sentiment in Malta remained above its long-term average but was unchanged from a month earlier. When compared with April, sentiment strongly ameliorated in the services sector and among retailers. It also improved slightly in construction. These developments were partly offset by weaker sentiment in industry and among consumers.
Additional survey information shows that price expectations increased in the retail and services sectors. On the contrary, price expectations in other sectors declined, with the largest decrease recorded in industry.
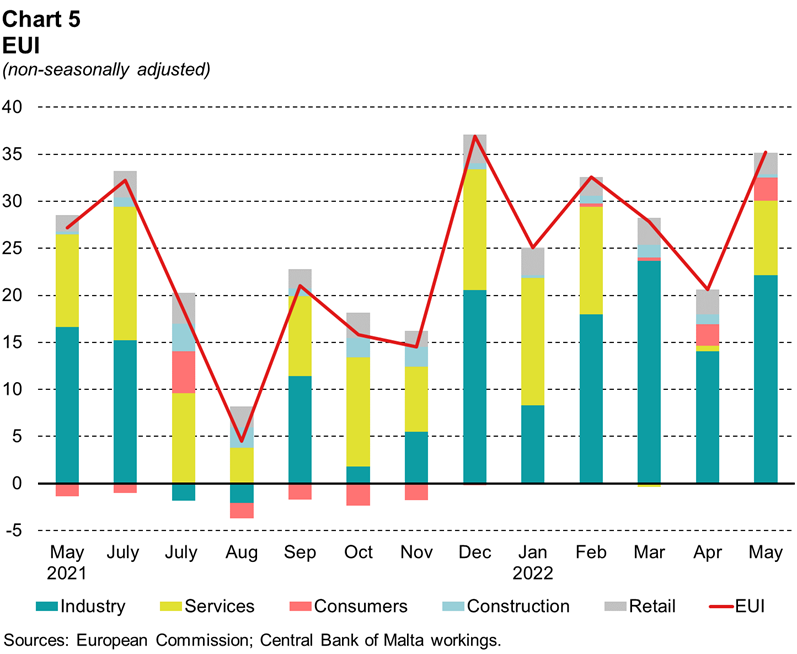
In May, the European Commission's Economic Uncertainty Indicator (EUI) increased when compared with April. Higher uncertainty was largely driven by developments in services and industry, and to a smaller extent, among consumers.
In April, industrial production contracted in annual terms, following a small rise a month earlier. The volume of retail trade rose at a faster pace. The unemployment rate was marginally lower than that recorded in March and below last year's rate.
Commercial and residential permits increased in April relative to their year-ago levels. In May, the number of promise-of-sale agreements fell on a year-on-year basis while final deeds of sale rose slightly.
The annual inflation rate based on the Harmonised Index of Consumer Prices (HICP) stood at 5.8% in May, up from 5.4% in the previous month. Inflation based on the Retail Price Index (RPI) edged up to 6.0% in May, from 5.7% a month earlier.
Maltese residents' deposits expanded at an annual rate of 8.8% in April following an increase of 10.1% in the previous month while annual growth in credit to Maltese residents stood at 7.8%, marginally above the rate of 7.7% recorded a month earlier.
The Consolidated Fund deficit in April 2022 narrowed compared with a year earlier as expenditure fell while revenue rose slightly.
Central Bank's Business Conditions Index2
The Bank’s BCI indicates that annual growth in business activity has normalised from its record highs registered in the first half of 2021, returning to its historical average (see Chart 1).3 Amongst BCI components, growth was highest in the case of tourist arrivals, development permits and the gross domestic product (GDP). Moreover, the unemployment rate continued to fall in annual terms. On the other hand, other variables such as the index of industrial production and the economic sentiment indicator have fallen in recent months when compared to their year-ago levels.
Box 1: COVID-19 Government Response Index – Malta
In May, COVID-19 containment measures eased markedly compared with the previous month. In particular, weddings and other social events were allowed to resume as in pre-COVID times and face masks were no longer required in public places. The mandatory use of face masks was only retained inside hospitals, health clinics and care homes. Contact tracing protocols were relaxed further, as mandatory quarantine for primary contacts and for household members was lifted, irrespective of their vaccination status. As a result, only COVID-positive persons were required to quarantine. Furthermore, the quarantine period was reduced to one week following a negative test. Travel requirements were also relaxed as countries were no longer classified into Red or Dark Red, and a Passenger Locator Form was no longer required for travel to Malta. Instead, people travelling to Malta now only need a vaccination certificate, a negative swab test, or a COVID-19 recovery certificate.
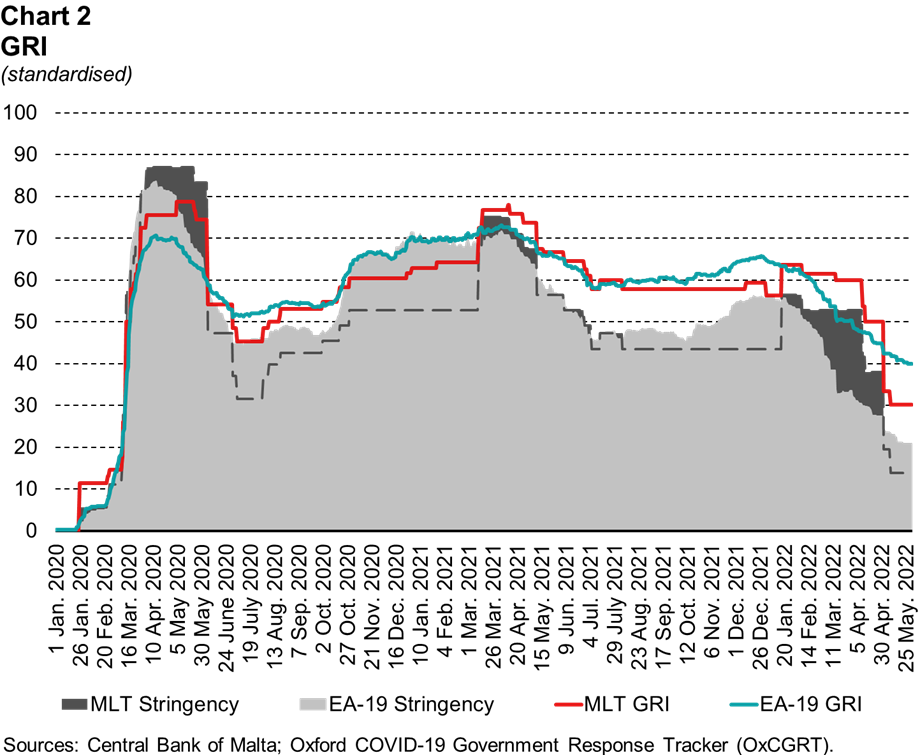
Following these developments, Malta’s COVID-19 Government Response Index (GRI) ended May at 30.2, down by 19.8 points from April (see Chart 2). Malta’s index stood 9.8 percentage points lower than the euro area average, which closed the month at 40.0.
Meanwhile, Malta’s Stringency Index declined by 24.1 percentage points from its level at end-April, to stand at 13.9. It stood 7.0 percentage points below than that in the euro area, which ended May at 20.9.
Business and consumer confidence indicators
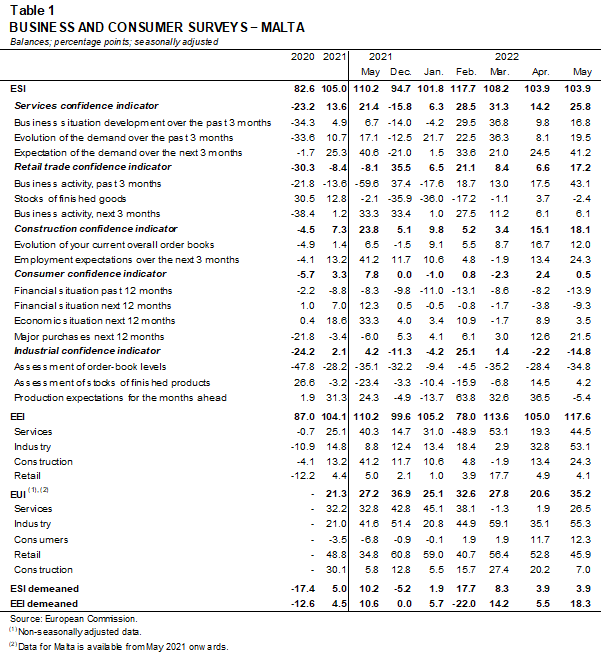
In May, the European Commission’s Economic Sentiment Indicator (ESI) for Malta stood at 103.9, slightly below the euro area average of 105.0. The indicator for Malta was unchanged from a month earlier but below its level in May 2021 (see Table 1).4,5,6,7
In month-on-month terms, sentiment in Malta increased most in the services sector and among retailers. Confidence also improved slightly in the construction sector. However, it weakened in industry and among consumers. In May, sentiment was positive across all sectors, bar industry.
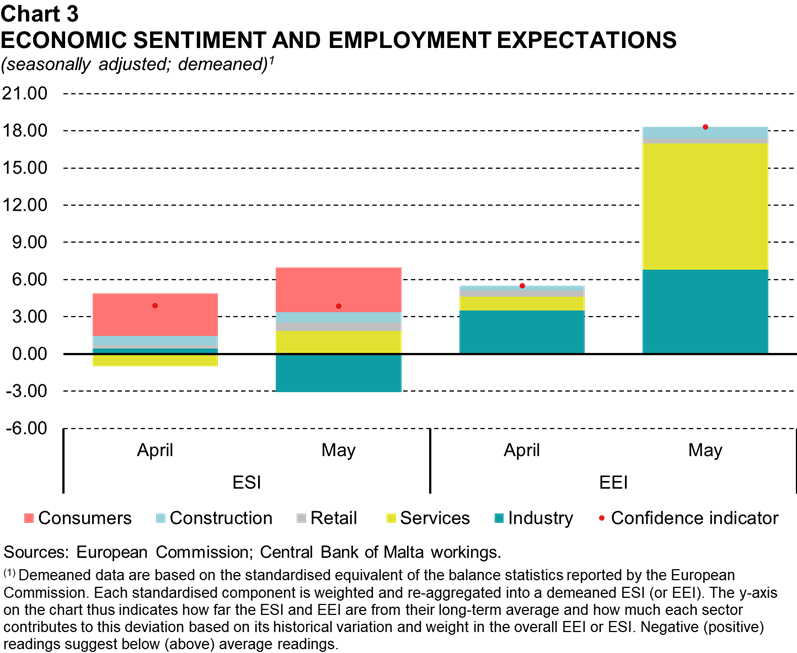
Demeaned data – which account for the variation in weights assigned to each sector in the overall index – show that the contribution of industry fell into negative territory in May, while that of services turned positive (see Chart 3). Demeaned data also suggest that the confidence indicators for consumers and services largely explain why the ESI stood above its long-term average in May.
In May, confidence within the services sector increased sharply to 25.8 from 14.2 in April, thus standing well above its long-term average of 19.1.8 This increase in confidence largely stems from firms’ expectations of demand over the next three months. At the same time, participants’ assessment of demand and of the business situation in recent months also improved relative to April.
Sentiment in the retail sector more than doubled in May from a month earlier, to 17.2. This is well above its long-term average of -0.9.9 Retailers’ assessment of sales over the past three months improved considerably compared to April. Meanwhile, and in contrast to April, on balance respondents assessed their stock levels to be below normal.10
Sentiment within the construction sector edged up to 18.1, from 15.1 in the previous month and stood above its long-term average of -9.3.11 Higher sentiment was entirely driven by developments in participants’ employment expectations, which stood more positive in the month under review. By contrast, while still positive, order expectations weakened.
Consumer confidence decreased to 0.5 in May, from 2.4 in April. Notwithstanding this decline, sentiment remained well above its long-term average of -10.2.12 Consumers’ assessment of their financial situation over the last 12 months and their expectations of their financial situation in the coming months deteriorated further. At the same time, the outlook for the general economic situation over the next 12 months edged down but remained positive. These developments offset improved expectations of major purchases over the same period.
In May, sentiment in industry stood at -14.8, down from -2.2 in April, and well below its long-term average of -3.9.13 In contrast to April, firms’ production expectations for the months ahead turned negative. At the same time, a larger share of participants assessed their order book levels to be below normal. By contrast, the share of respondents assessing their stocks of finished products to be above normal, decreased in May.
Additional survey information shows that price expectations rose in the retail and services sectors, reaching a record high in the former (see Chart 4). Price expectations decreased in other sectors, with the largest decline recorded in industry.
Notwithstanding mixed developments in month-on-month terms, price expectations were significantly above their year-ago level in all sectors, barring the construction sector.
The European Commission’s Employment Expectations Indicator (EEI) – which is a composite indicator of employment expectations in industry, services, retail trade and construction – increased in May.14 The EEI stood at 117.6, above the 105.0 recorded in April and exceeding its long-term average of around 100.0. Following the recent rise in expectations, the EEI also stood above the euro area average of 112.9.
The recent month-on-month increase in employment expectations was mostly driven by the services and industry sectors. Employment expectations also improved, albeit to a smaller extent, in the construction sector. By contrast, there was a slight deterioration among retailers, although employment expectations were positive across all sectors (see Table 1). Demeaned data show that the services sector largely explains why the overall EEI stood above its long-term average in May (see Chart 3).
In May, the European Commission’s EUI – which is a composite indicator of how difficult it is for sectors to make predictions about their future financial or business situation increased to 35.2 from 20.6 in April, signalling higher uncertainty (see Table 1). Following the latest increase, the uncertainty indicator stood above that of the euro area, where the index eased to 23.4 and above its level recorded in May 2021 (see Chart 5).15,16
In month-on-month terms, the rise in Malta’s uncertainty indicator was largely driven by higher uncertainty in services and industry, and to a smaller extent, among consumers. These developments offset lower uncertainty among retailers and in the construction sector.
Activity indicators
In April, annual growth in the index of industrial production – which is a measure of economic activity in the quarrying, manufacturing and energy sectors – stood at -8.6%. This follows a rise of 2.0% in March (see Table 2).17
The recent decline in industrial production partly reflected a substantial decrease in the output of firms that produce “other manufacturing” goods – which includes medical and dental instruments, toys and related products – pharmaceutical goods, those that print and reproduce recorded media as well as firms producing food. Smaller falls were recorded in the industries specialising in chemicals and metal products, mining and quarrying as well as those involved in the production of motor vehicles, trailers and semi-trailers. On the other hand, higher output was registered among firms specialising in wearing apparel, other non-metallic mineral products, computer, electronic and optical products as well as beverages.
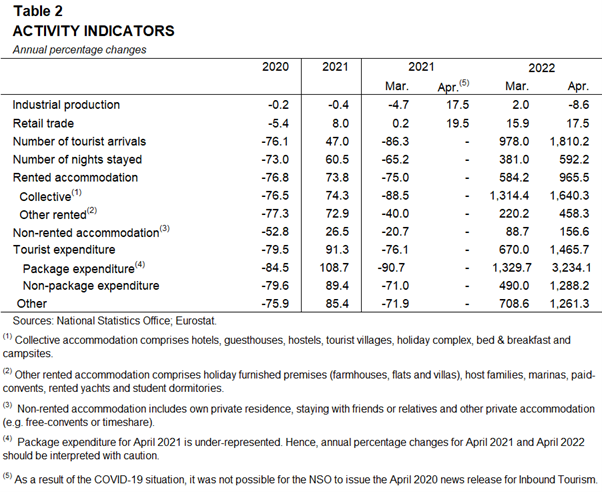
Production in the energy sector fell for the first time after six monthly consecutive increases. In April, energy output fell by 24.6% in annual terms.
In April, the volume of retail trade – which is a short-term indicator of final domestic demand – increased by 17.5% in year-on-year terms, after rising by 15.9% in March.
In April, the tourism sector registered further gains over a year earlier, although tourist numbers remained below pre-pandemic levels. The number of inbound tourists stood at 194,545 in April, up from 10,184 a year earlier. Nonetheless, it was 19.6% less than the number of inbound tourists in April 2019. Guest nights were nearly seven times those registered in April 2021, with collective accommodation registering the highest rise in absolute terms. Total expenditure was also significantly higher than the level recorded in the corresponding period of 2021 but still below pre-pandemic levels.
In April, 324 development permits for commercial buildings were issued, compared with 267 permits issued in the same month a year earlier (see Table 3). Meanwhile, 861 new residential permits were issued in April, 98 more than the number issued in April 2021.
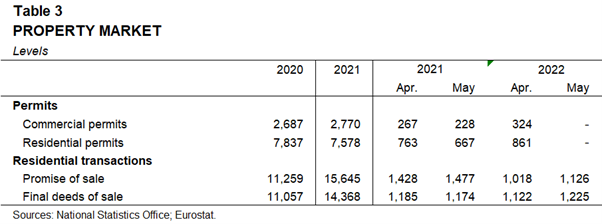
Data on residential property transactions show that 1,225 final deeds of sale were concluded in May, 4.3% more than a year earlier. At 1,126, the number of promise-of-sale agreements was around a quarter less than that registered in May 2021.
Customs data show that the merchandise trade deficit stood at €375.5 million in April, up from €286.9 million a year earlier. The larger deficit was due to a €52.2 million rise in imports as well as a €36.4 million decline in exports (see Chart 6).
Higher imports were on account of a substantial increase in the fuel import bill as well as higher registrations of aircrafts and greater imports of electrical machinery, and iron and steel. These offset a substantial decline in registrations of sea vessels and lower imports of machinery and mechanical appliances as well as organic chemicals.
The drop in exports was driven by lower exports of pharmaceutical products, re-exports of fuel and toys. These offset higher exports of electrical machinery and printed material.
Labour market
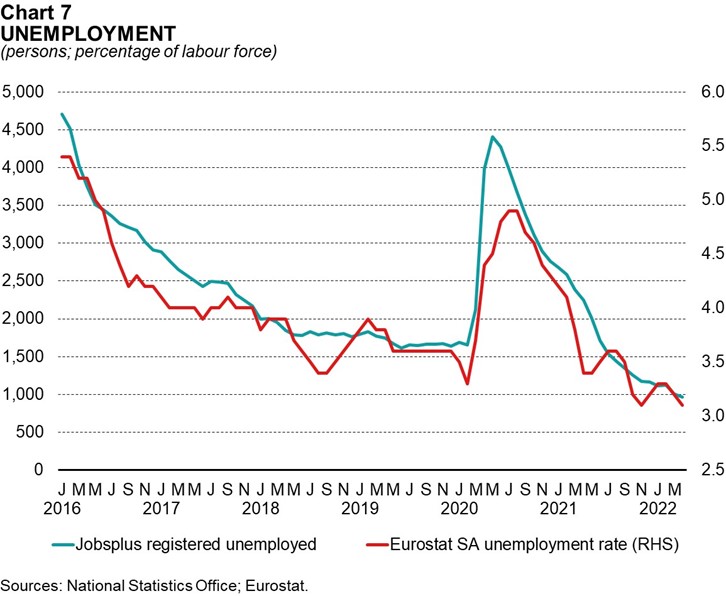
Jobsplus data show that the number of persons on the unemployment register stood at 963 in April 2022, down from 1,008 in March 2022 and from 2,248 a year earlier – when the labour market was still impacted by the pandemic-related restrictions (see Chart 7). The number of registered unemployed has now stood below pre-pandemic levels since mid-2021.
The seasonally-adjusted unemployment rate stood at 3.1% in April 2022, marginally lower than the rate registered in the previous month and below the rate of 3.4% registered in April 2021.
Prices, costs and competitiveness
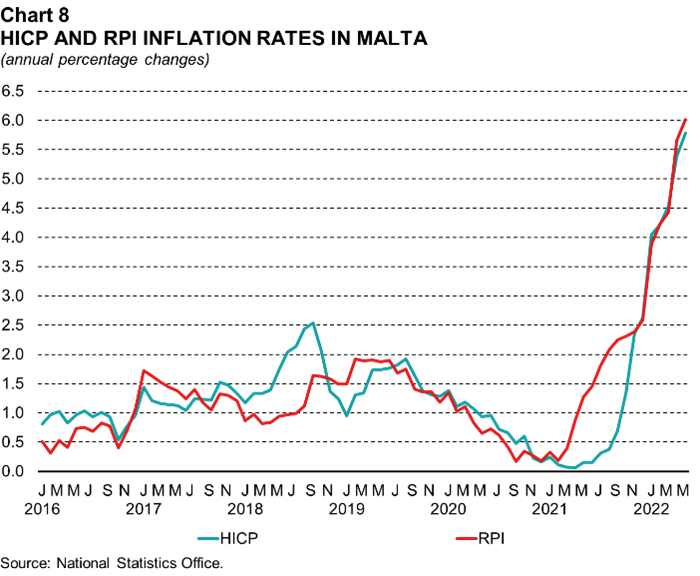
Annual HICP inflation edged up to 5.8% in May, from 5.4% in the previous month (see Chart 8). This increase was largely driven by food inflation, which reached 8.7%, up from 7.5% in the previous month. The rise in food inflation was in turn largely driven by unprocessed food inflation which rose to 14.9% from 12.2% in April. Processed food inflation also rose, reaching 6.8% in May, from 6.0% in the previous month. Inflation in the services subcomponent edged up by 0.2 percentage point to 5.8% in May while non-energy industrial goods inflation was unchanged from the previous month, at 4.5%. Similar to recent months, energy prices remained unchanged reflecting government measures aimed at mitigating foreign price pressures on this subcomponent.
Annual inflation according to the RPI stood at 6.0% in May, up from 5.7% in April (see Chart 8).18 Faster growth was recorded across most components, with the largest change registered in the transport and communication sector and food. Overall, housing and food contributed most to inflation in May, as prices for these categories rose by 15.5% and 9.9%, respectively.
Producer output inflation as measured by the industrial producer price index, stood at 5.7% in April, down from 7.1% in March.19 The deceleration was driven by slower growth in the prices of intermediate goods and non-durable consumer goods. These movements were slightly offset by a rise in inflation in durable consumer goods and capital goods. Energy prices remained unchanged in the month under review.
Malta’s nominal harmonised competitiveness indicator (HCI) declined by 2.4% in the year to May 2022, reflecting the depreciation of the euro exchange rate against currencies of trading partners.20 The real HCI, which also considers relative price changes, fell by 4.8% in annual terms in May, as favourable developments in relative prices vis-à-vis trading partners have amplified the competitive advantage from a weaker euro.
Public finance
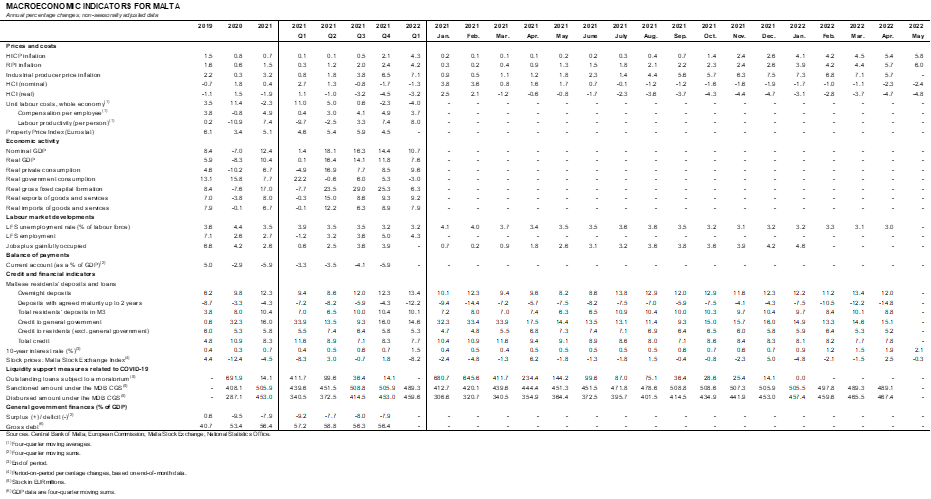
During April 2022, the Consolidated Fund recorded a deficit of €17.1 million, an improvement of €35.3 million when compared to the deficit registered in April 2021 (see Table 4). This occurred due to a decline in government expenditure and – albeit to a lower extent – a rise in government revenue. In turn, the primary balance registered a surplus of €1.0 million, in contrast to the primary deficit of €37.0 million registered a year earlier.
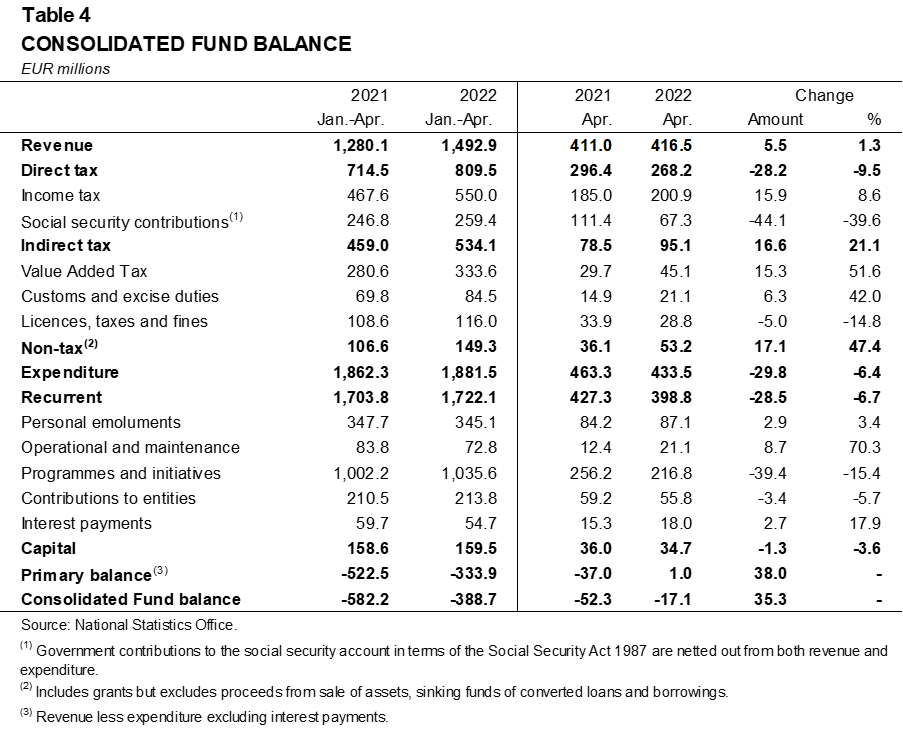
Government revenue increased by €5.5 million, or 1.3% in annual terms, on the back of an increase in indirect taxes and non-tax revenue. The latter rose by €17.1 million, driven by higher grants receivables and inflows from profits transferred by the Central Bank of Malta. At the same time, revenue from indirect taxes increased by €16.6 million, largely on the back of higher VAT receipts. This rise was however partly offset by a €28.2 million drop in direct taxes, mainly due to the timing of social security contributions.
Government expenditure declined by €29.8 million, or 6.4% when compared to the corresponding period in 2021. This was largely due to a fall in recurrent expenditure which declined by €28.5 million, mainly on the back of lower outlays on programmes and initiatives. The latter fell by €39.4 million, partly reflecting the timing of social benefits coupled with lower spending on COVID-related outlays. The month under review also saw lower outlays on contributions to government entities, which declined by €3.4 million. These movements offset higher spending on operational and maintenance, personal emoluments, and interest payments, which rose by €8.7 million, €2.9 million, and €2.7 million respectively.
Meanwhile capital expenditure declined by €1.3 million, partly reflecting lower IT-related outlays.
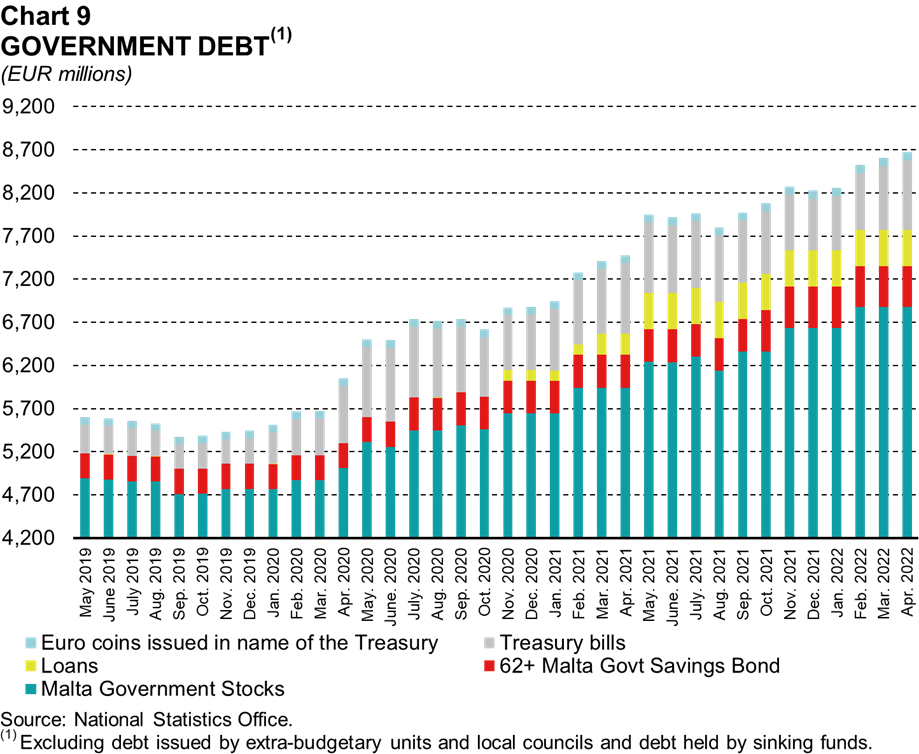
In April 2022, the total stock of government debt amounted to €8,532.4 million, an increase of €66.1 million when compared with a month earlier (see Chart 9). This was due to a rise in outstanding Treasury bills.
Deposits, credit and financial markets
In April, residents’ deposits held with monetary financial institutions (MFI) and forming part of broad money (M3) expanded at an annual rate of 8.8%, down from 10.1% a month earlier (see Chart 10).
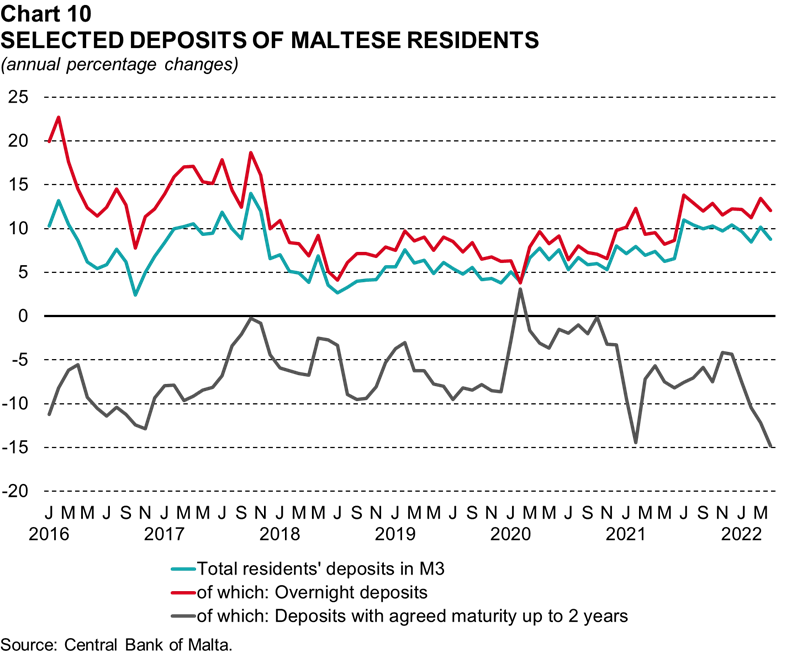
Overnight deposits remained the largest component of residents’ M3 deposits, comprising around 90% of their M3 balances. This deposit category – which is the most liquid – grew by 12.0% in the year to April, below the 13.4% recorded in the previous month. Meanwhile, time deposits with a maturity of up to two years – the second largest deposit category – fell by 14.8% in annual terms, following a contraction of 12.2% in March. This may reflect efforts by certain credit institutions to reduce the number of fixed term deposit accounts.
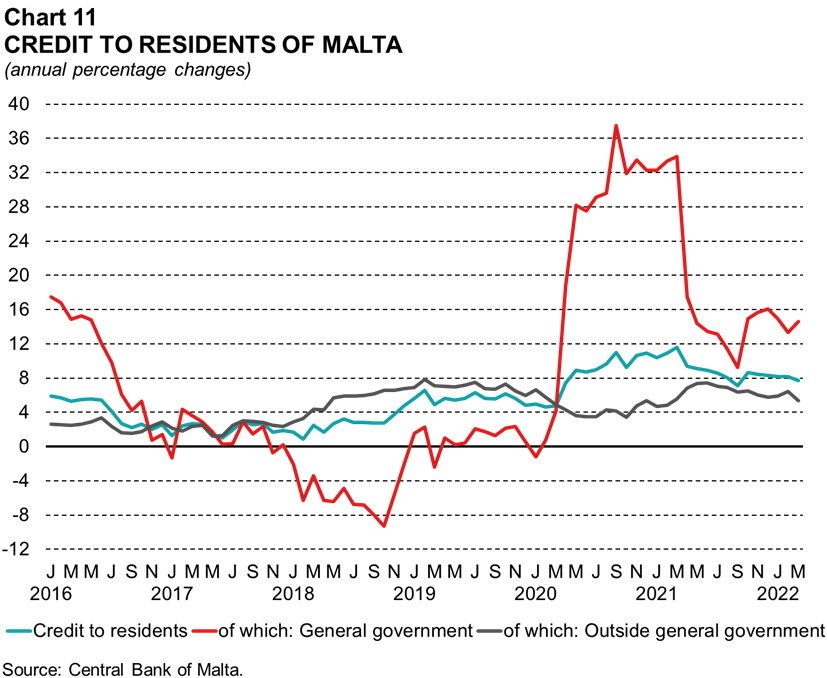
Credit to Maltese residents grew at an annual rate of 7.8% in April, marginally above the 7.7% recorded a month earlier (see Chart 11). The slight increase in growth was driven by a faster rise in credit to general government. Annual growth in this component stood at 15.1%, following a 14.6% increase in March. By contrast, growth in credit to residents outside general government remained broadly unchanged at 5.2%, from 5.3% a month earlier.
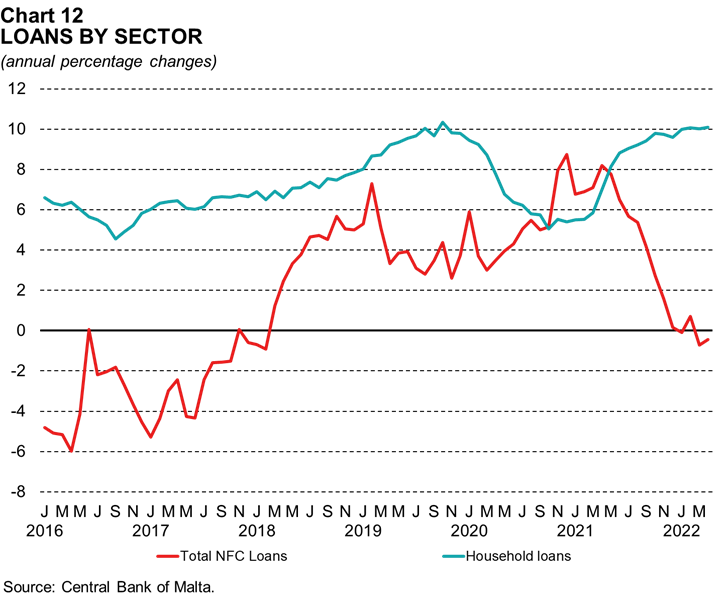
The annual rate of change in loans to households stood at 10.1% in April, broadly unchanged from 10.0% in March. Mortgage lending increased by 11.4% in April, unchanged from a month earlier. By contrast, consumer credit and other lending fell by 4.3%, following a contraction of 4.5% a month earlier.
Meanwhile, the annual rate of change in loans to non-financial corporations edged up but remained slightly negative in April. It stood at -0.5%, following a contraction of 0.7% a month earlier (see Chart 12). The smaller decline in April was largely driven by a recovery in loans to the real estate sector. This was followed by an increase in credit to the sector comprising administrative and support service activities and faster growth in loans to the manufacturing sector. By contrast, loans to the construction sector and to a smaller extent, those to the wholesale and retail trade sector rose at a slower pace.
By end-April, 639 facilities were approved and still outstanding under the COVID-19 Guarantee Scheme (CGS), covering total sanctioned lending of €489.1 million.21,22 Overall, €467.4 million were disbursed, up slightly from the €465.5 million disbursed by the end of March.
The sector comprising wholesale and retail activities had the largest number of facilities supported by the scheme and still outstanding by the end of April followed by the sector comprising of accommodation and food service activities. These sectors were also the most important in value terms. On this basis, they were followed by the construction sector as well as the sector comprising transportation, storage and information and communication.
As regards interest rates, in April, the composite interest rate paid by MFIs on Maltese residents’ outstanding deposits eased slightly to 0.15%. Similarly, the composite rate charged on outstanding loans also edged down by one basis point to 3.18% compared to March. As a result, the spread between the two rates was broadly unchanged at 303 basis points.
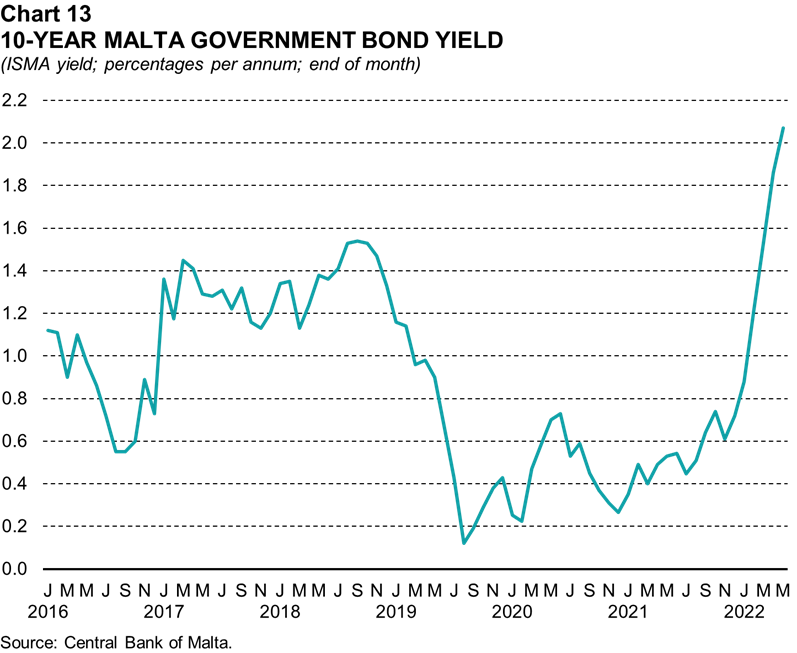
On the capital market, the secondary market yield on 10-year Maltese government bonds increased by 21 basis points from a month earlier to 2.07% at the end of May (see Chart 13). Maltese sovereign yields have been trending upwards in line with other euro area yields. This reflects the persistent high inflation in major advanced economies, which is resulting in higher interest rate expectations.
In May, the Malta Stock Exchange (MSE) Equity Price Index decreased by 0.3% when compared with the previous month. Similar movements were observed in the MSE Total Return Index, which accounts for dividends as well as changes in equity prices.
1 The cut-off date for information in this note is 14 June 2022. However, the cut-off dates for the HICP and the RPI are 17 and 21 June 2022, respectively. Most of the data reported in this issue of the Economic Update refer to April 2022. However, the latest data for the European Commission’s confidence and uncertainty indicators, HICP, RPI, the Bank’s BCI and the COVID-19 Government Response Index refer to May.
2 The methodology underlying the BCI can be found here. A zero value of the BCI is consistent with average business conditions, which in the case of Malta tends to be consistent with a real GDP growth rate of close to 4%. When the value of the BCI falls repeatedly below -1, economic activity would be significantly below normal. From June 2020, the BCI methodology was updated to include a new variable: monthly development permits
3 The volatility caused by the pandemic in most economic variables and the variation in the timing of turning points across indicators implies that as new observations are introduced in the estimation of the BCI each month, estimates of the BCI for earlier periods can be revised significantly. This is due to the filtering process embedded within the BCI.
4 The ESI summarises developments in confidence in five surveyed sectors: industry; services; construction; retail; and consumers. Weights are assigned as follows: industry 40%; services 30%; consumers 20%; construction 5%; and retail trade 5%.
5 Long-term averages are calculated over the entire period for which data are available. For the consumer and industrial confidence indicators, data became available in December 2002, while the services and construction confidence indicator data became available in May 2007 and May 2008, respectively. The long-term average of the retail confidence indicator is calculated as from May 2011, when it was first published. However, the long-term average of the ESI is computed from December 2002.
6 In January 2022, data were revised for previous periods following the annual updating of country weights and the inclusion of 2021 in the standardisation sample.
7 From May 2022, the seasonal adjustment method of all survey data has changed. As a result, all seasonally-adjusted past readings were revised slightly. For further details on the methodology used by the European Commission, see: https://ec.europa.eu/info/sites/default/files/bcs_user_guide.pdf
8 The services confidence indicator is the arithmetic average of the seasonally-adjusted balances (in percentage points) of replies to survey questions relating to the business climate, the evolution of demand in the previous three months and demand expectations in the subsequent three months.
9 The retail confidence indicator is the arithmetic average of the seasonally-adjusted balances (in percentage points) of replies to survey questions relating to the present and future business situation and stock levels.
10 Above normal stocks of finished goods have a negative effect on the overall indicator.
11 The construction confidence indicator is the arithmetic average of the seasonally-adjusted balances (in percentage points) of replies to two survey questions, namely those relating to order books and employment expectations over the subsequent three months.
12 The consumer confidence indicator is the arithmetic average of the seasonally-adjusted balances (in percentage points) of replies to a subset of survey questions relating to households’ assessment and expectations of their financial situation, their expectations about the general economic situation and their intention to make major purchases over the subsequent 12 months. The computation of this indicator was changed as reflected in the January 2019 release of the European Commission: https://ec.europa.eu/info/sites/info/files/esi_2019_01_en.pdf
13 The industrial confidence indicator is the arithmetic average of the seasonally-adjusted balances (in percentage points) of replies to a subset of survey questions relating to expectations about production over the subsequent three months, to current levels of order books and to stocks of finished goods.
14 The EEI is based on question 7 of the industry survey, question 5 of the services and retail trade surveys, and question 4 of the construction survey, which gauge the respondent firms’ expectations as regards changes in their total employment over the next three months. Before being summarised in one composite indicator, each balance series is weighted on the basis of the respective sector’s importance in overall employment. The weights are applied to the four-balance series expressed in standardised form. Further information on the compilation of the EEI is available in: European Commission (2020), The Joint Harmonised EU Programme of Business and Consumer Surveys User Guide.
15 The EUI is made up of five balances (in percentage points) which summarise managers’/consumers’ answers to a question asking them to indicate how difficult it is to make predictions about their future business/financial situation. The series are not seasonally adjusted. The five-balance series are summarised in one composite indicator using the same weights used to construct the ESI. The questions asked correspond to Q51 of the industry survey, Q31 of the services survey, Q41 of the retail trade and construction surveys and Q21 of the consumer survey.
16 Data on consumer uncertainty became available in October 2020, while data for industry, services, retail and construction became available in May 2021.
17 The annual growth rates of the overall industrial production index are based on working-day adjusted data. Unadjusted data, however, are used for the components.
18 The RPI and the HICP both measure changes in consumer prices but through different methodologies. The HICP index weights are based on total expenditure in Malta, including that by tourists. In contrast, RPI weights only take into account expenditure by Maltese households. Due to the strong impact of the pandemic on tourist expenditure, the two measures are expected to deviate significantly as weights in the HICP have changed significantly while those of the RPI have not been adjusted.
19 The industrial producer price index measures the prices of goods at the factory gate and is commonly used to monitor inflationary pressures at the production stage.
20 HCIs act as an effective exchange rate measure for countries operating within the euro area monetary union. The nominal HCI tracks movements in the euro exchange rate against the currencies of Malta’s main trading partners, weighted according to the direction of trade in manufactured goods. On top of this, the real HCI also takes into account the relative inflation rate of Malta vis-à-vis its main trading partners. A higher (or lower) score in the HCI indicates a deterioration (or improvement) in Malta’s international price competitiveness.
21 The CGS is administered by the Malta Development Bank for the purpose of guaranteeing new loans granted by commercial banks for working capital purposes to businesses facing liquidity shortfalls as a result of the pandemic. The scheme enables credit institutions to leverage government guarantees up to a total portfolio volume of €777.8 million. It was approved by the European Commission on 2 April 2020. See https://mdb.org.mt/en/Schemes-and-Projects/Pages/MDB-Working-Capital-Guarantee-Scheme.aspx for further details.
22 The number and value of sanctioned facilities fell when compared with the preceding month reflecting the repayment in full of some facilities as well as the withdrawal and cancellation of other facilities.